
Debugger for MySQL: How It Works
This guide will walk you through the basics of using the debugger. It also describes the technologies that made the very process of debugging stored MySQL / MariaDB procedures, functions and events possible.Technology
MySQL is an extremely popular database management system. Thousands of developers have chosen it as an engine for their small- and mid-scale database-driven systems. Thanks to its versatility and flexible capabilities, MySQL has won attention of millions of web developers all over the world. Alas, MySQL doesn’t provide an API or any other convenient way to debug a code, and this seems to be the main disadvantage of this almost ideal in all other ways system. Debugger for MySQL fills that gap! It provides a smart and easy way to debug MySQL code. Its standalone syntax compiler runs a code of functions and procedures in its own framework precisely emulating the behavior of a full-functional MySQL server. The full control over a code provided by the compiler allows you to obtain all the information on the current context – to learn local and global variable values, to see the data in tables, to track the way a function was executed and so on. The complete support of all customary developer tools, including conditional breakpoints, call stack, watches, output and SQL window makes MySQL Debugger a genuine professional tool, without compromises!The Main Tab
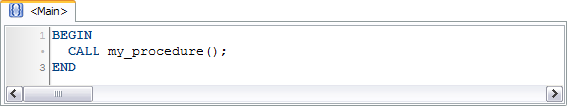
This is what you see right after the program starts up. Here you can write a code needed to call a function or procedure you want to debug (see below). But not only debugging is the purpose of the Main tab. It works as a universal container for virtually any piece of code. You can write several debug calls, intermediate calculations, helper function calls, or even place a arbitrary block of code to debug – you decide. MySQL Debugger doesn’t put any restrictions here; it is all up to you.How to Debug a Procedure
To debug a stored procedure you need to place the following procedure call into the Main tab:
Happily, you don’t need to write this code manually. MySQL Debugger features the “Configure environment” command which does all the work for you. Here is a step-by-step:
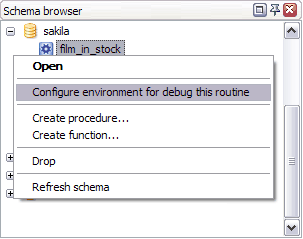
1. Right-click the desired procedure in the Schema browser and select “Configure environment for debug this routine”.
2. MySQL Debugger takes the selected procedure and inserts a proper CALL statement into the Main script. For instance, for the following procedure the debugger generates the following code:
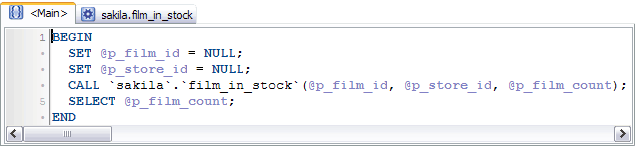
Notice how MySQL Debugger correctly interprets both in and out parameters and writes corresponding code lines automatically.
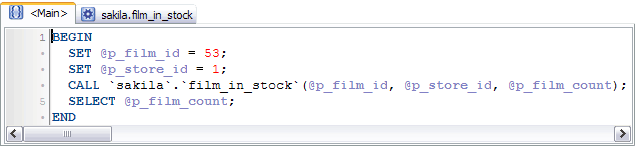
3. Now you need to specify the values of parameters passed to the procedure if they exist. Simply replace a NULL placeholder after the equal sign of a corresponding line with a desired value or an expression. MySQL Debugger doesn’t limit you in what you can write there, it provides a flexible and natural way to adjust every parameter the way you like.
4. Finally, Run (F9).
How to Debug a Function
Debugging of a function is very similar to that of a procedure.
1. Select the desired function and choose the “Configure environment” command from the right-click menu.
2. MySQL Debugger creates a piece of code in the Main script based on the header of that function. For instance, let’s say we have a function:
For this function MySQL Debugger writes the following code:
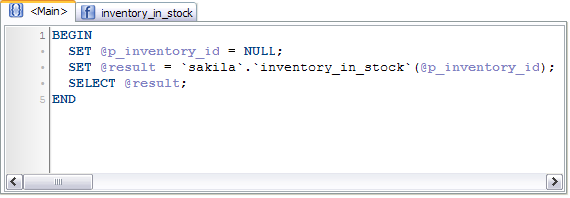
As you can see, there are not only the lines that assign values for in parameters, but also the value of the function itself is assigned to the result variable.
3. Specify the values of in parameters just like you do with procedures.
4. Run(F9) the resulting script.
Important notice: you cannot debug a function if it was called from one of the DML(Data Manipulation) statements. These are INSERT, DELETE, UPDATE and SELECT. DML statements are executed on the server’s side, and the debugger has no control over the execution.
Considering this, you CAN debug the functions called these ways:
  SET x=myfunc();
  SET x=y*myfunc(z);
  DO myfunc();
  CALL myproc(1, 2, myfunc());
But you CAN NOT debug the ones called like this:
  SELECT myfunc();
  INSERT INTO mytable VALUES(myfunc());
  SELECT * FROM mytable WHERE id=myfunc();
How to Debug a Event
Debugging of a event is very similar to that of a procedure.
1. Select the desired event and choose the “Configure environment” command from the right-click menu.
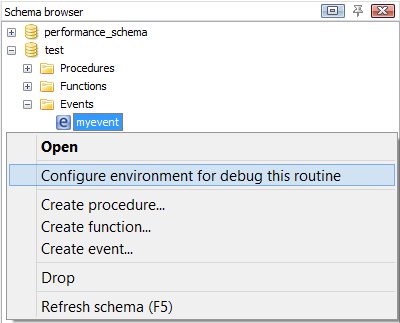
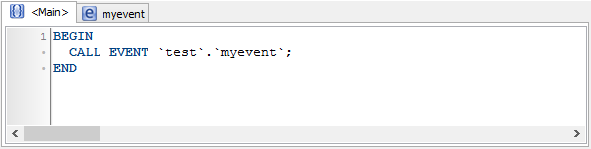
2. MySQL Debugger takes the selected event and inserts a proper CALL EVENT (available to be called only from the Main script) statement into the Main script.
3. Finally, Run (F9).
Run vs. Compile
What is the difference between Run (F9) and Compile (Ctrl+F9) commands? The Run command compiles the script and executes it, while the Compile command merely compiles the code. The first command allows you to execute commands etc. The second command only compiles the code, that is: does a syntax checking and allows you to see if the code you’ve just wrote compiles without errors and works. Indeed, why running a complex script with lots of INSERTs and SELECTs and loading the server, when you only need to now if it compiles at all?
To finally clarify: the Run command compiles the code and executes it, the Compile command – only compiles, not actually executing the code. The Save or Save All command is the only command that applies changes and saves modules onto a server.
| © 2010 - 2020 MyDebugger.com | Contact us | Privacy Policy |